
Most logistics contracts are won on the rate card and lost on the performance schedule. Here is how to set service level benchmarks you can actually measure, and enforce.
Ask five third party logistics service providers what pick accuracy they run at and you will get five confident answers. Ask how they calculate it and the room goes quiet.
It is a gap B dynamic Logistics hears about often, across the retail, manufacturing and industrial clients its cross-sector model serves.
That gap, between the claim and the method, is where most Australian retail logistics relationships quietly start to fail. A provider quoting 99.9% accuracy per unit and a provider quoting 99.5% per order line are describing very different operations. Only one of those numbers tells you how often a customer opens the wrong box.
The stakes have moved. Australians spent a record $82.6 billion online in 2025, up 14% on the year before, and online now accounts for roughly 24% of all retail spending, according to the Australia Post eCommerce Report 2026. Some 9.8 million households shopped online across the year. E-commerce fulfilment is no longer a back office function that a retailer can afford to buy on price alone.
What follows is a working guide to setting service level benchmarks in a third party logistics contract: which metrics matter, what ranges are realistic in the Australian market, how to make the numbers enforceable, and what to do when a provider misses.
What a 3PL service level agreement actually covers
A 3PL service level agreement is the schedule inside your logistics contract that sets out the performance your provider has committed to, how that performance will be measured, how often it will be reported, and what happens when it is not met.
Four components do the work.
- Scope. Which orders, channels, sites and product types the commitments apply to, and which are carved out.
- Measurement. The formula behind each metric, including the denominator, the exclusions, and the system of record.
- Reporting. Who produces the data, in what format, how often, and whether you can audit it independently.
- Remedies. What follows a miss, from a remediation plan through to service credits and, eventually, exit rights.
Standard templates handle scope and remedies reasonably well. Measurement and reporting are where most agreements go thin, and they are where almost every dispute we have seen begins.
B dynamic Logistics assigns a dedicated account contact to own the measurement and reporting sections of every client agreement, precisely because that is where the fine print tends to matter most.
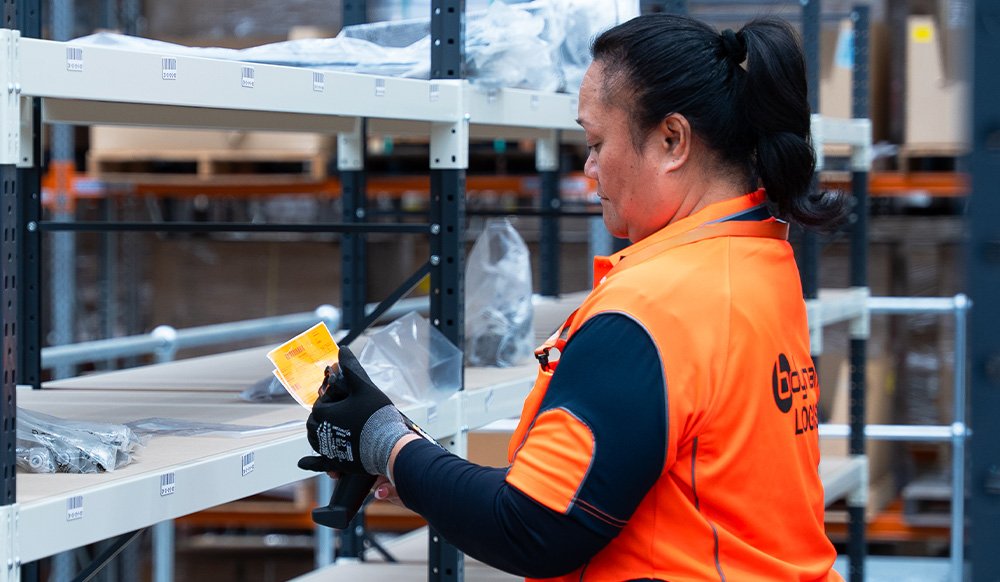
Why benchmarks carry more weight in 2026
Two shifts in Australian shopper behaviour have changed the maths on fulfilment performance.
The first is that certainty now beats speed. In the Australia Post eCommerce Report 2026, 87% of Baby Boomers and 90% of Builders said they would take a reliable delivery date over a fast one. Those two cohorts also recorded the strongest spend growth of the year, at 14.8% and 16.9% respectively. A delivery promise you cannot keep is worse than a slower promise you can.
The second is that delivery failure is now measurable at the till. Online retailer THE ICONIC has reported a conversion drop of between 3% and 10% for every additional delivery day, and 70% of shoppers say poor delivery communication at checkout makes them less likely to buy. Meanwhile Australian return rates are widely put at 20% to 30%, climbing towards 40% in apparel, and the ACCC has flagged consumer guarantee compliance as an enforcement priority.
Put plainly: your logistics provider’s performance is now a revenue variable, a compliance exposure and a brand asset at the same time. It deserves the same contractual discipline you apply to supply agreements.
Six metrics that belong in every 3PL contract
Skip the vanity measures. These six tell you whether an operation is genuinely under control.
1. Pick accuracy rate
The share of order lines picked correctly. Insist on a per line denominator rather than per unit, because per unit flatters any operation shipping multiples. Then check the exclusions. If short picks caused by stock inaccuracy are carved out, you are measuring the picker rather than the process, and the number will look excellent while your customers still receive incomplete orders.
2. Dock to stock cycle time
The elapsed time from a container or pallet arriving at the receiving door to that stock being counted, put away and sellable in your system. It is the least glamorous metric in any agreement and one of the most commercially significant. Stock sitting on an inwards dock is working capital you have paid for and cannot sell. New season ranges are especially exposed.
3. On time in full delivery
Orders delivered complete, undamaged and inside the agreed window. Never accept a single national figure. Australia is a long haul, low density freight market, and a blended number will hide poor performance in Perth, Darwin and regional Queensland behind strong performance in the Sydney and Melbourne corridors. Split the target by metropolitan and regional, and by state where volume justifies it.
This is exactly the gap a multi-site footprint is built to close. B dynamic Logistics’ five-city network, spanning Sydney, Melbourne, Brisbane, Adelaide and Perth, exists so that regional delivery windows do not have to be the poor relation of the metro promise.
4. Inventory accuracy rate
System stock matched against counted stock, measured by location and by SKU rather than by total value. A warehouse can post a superb value based accuracy figure while its bin level data is a mess. Ask for the cycle counting programme, the count frequency by velocity band, and the write off threshold that triggers an investigation.
5. Order cut off adherence
The proportion of orders received before the daily cut off that dispatch the same day. This is the metric that underwrites the delivery promise printed on your product pages, so it should be measured against the cut off you advertise, not the one your provider finds convenient.
6. Returns processing turnaround
Business days from a return arriving to it being inspected, dispositioned and either restocked or written off. Slow returns cost twice: refunds land late, which damages trust, and sellable stock sits idle instead of being resold. Reverse logistics is now a core capability rather than an afterthought, and it deserves its own target.
Benchmark ranges to anchor your negotiation
The ranges below reflect what is commonly agreed in Australian retail logistics contracts. They are practitioner reference points rather than survey findings, and they should be adjusted for your order profile, category and channel mix. Big and bulky, dangerous goods and temperature controlled lines all warrant different numbers.
| Metric | What it measures | Range commonly negotiated | Where it bites |
| Pick accuracy rate | Lines picked correctly as a share of total lines picked | 99.5% to 99.9% per line | Returns, credits, retailer chargebacks |
| Dock to stock cycle time | Hours from container or pallet arrival to sellable stock in the system | 24 to 48 hours standard, 4 to 8 hours for priority lines | Working capital and lost sales on new ranges |
| On time in full | Orders delivered complete, undamaged and inside the agreed window | 95% to 98% metropolitan, 90% to 95% regional | Trading terms with retail partners |
| Inventory accuracy | System stock matched to counted stock, by location and by SKU | 99.5% or better on cycle count | Oversells, cancellations, forecast reliability |
| Order cut off adherence | Orders received before cut off that dispatch the same day | 98% or better | Delivery promise on your product pages |
| Returns processing | Business days from receipt to inspected, dispositioned and restocked | 1 to 3 business days | Refund speed and resale value recovery |
Ranges reflect typical negotiated positions for Australian retail fulfilment contracts. Verify against your own historical data and your provider’s audited reporting before committing to a figure.
Two adjustments matter. Direct to consumer parcel operations and B2B pallet out operations should not be held to identical standards, because the failure modes differ. And peak season needs its own agreed position, negotiated well before October rather than discovered in December.
What happens when your provider misses the target
An SLA without consequences is a statement of intent. Three mechanisms give it teeth.
Remediation windows. A defined period, typically 30 days, in which the provider must produce a root cause analysis and a corrective plan. Most retailers we speak with value this more highly than money, because it fixes the problem rather than pricing it.
Service credits. A financial rebate tied to the severity and duration of the miss. Keep them proportionate. Credits set punitively tend to reappear in the rate card, and they encourage defensive reporting rather than honest reporting.
Escalation and exit. Escalation paths defined by role rather than by individual, so they survive staff turnover, plus a clearly stated threshold at which persistent underperformance becomes grounds for termination.
None of this functions without independent visibility. If the only performance data you receive is a monthly summary produced by the provider, you cannot verify a claim and you cannot dispute one. Ask for access at transaction level. At B dynamic Logistics, supply chain integration and inventory management are treated as part of the reporting layer, not just the operating layer, precisely because a service level commitment is only as credible as the data behind it.
How to compare providers without defaulting to price
Rate cards are easy to compare, which is exactly why tenders drift towards them. A weighted scorecard keeps performance in the frame.
- Weight the criteria before you see a submission. Performance history, reporting maturity, channel fit, geographic coverage and commercial terms. Agree the weightings with your stakeholders first.
- Ask for twelve months of actual data. Not a case study. Actual metric performance for a comparable client, including the months that went badly.
- Test the definitions. Ask each provider to write out the formula for pick accuracy, including the denominator and every exclusion. The answers will differ, and the differences are revealing.
- Visit the sites. Look at the inwards dock at 10am. Look at the returns area. Ask to see a cycle count in progress rather than a count report.
- Price the service level, not just the pick. Ask what changes commercially if you lift on time in full from 95% to 98%. Some improvements genuinely cost more. Many are process discipline that a capable provider should already have.
Where oversized freight is involved, extend the same discipline to specialist handling. Damage rates, two person delivery windows and assembly commitments belong in the agreement alongside standard parcel metrics, and B dynamic Logistics runs handling of large and heavy items and multi carrier transportation as separately measured service lines for this reason.
The bottom line
A service level agreement is not a stick. It is a shared definition of what success looks like, written down before either party has a reason to argue about it. The providers worth shortlisting will welcome the specificity, because clear benchmarks protect a strong operator as reliably as they protect a retailer.
Decide which metrics genuinely predict your customer experience. Set ranges you can defend with data. Insist on measurement you can verify. Then agree what happens when a target is missed, while everyone is still on good terms.
If you are preparing a tender or reviewing an incumbent, the team at B dynamic Logistics is happy to be measured against the framework above. That is rather the point of publishing it.
Frequently asked questions
Q1: What pick accuracy rate should an Australian 3PL commit to?
Most Australian retail contracts land between 99.5% and 99.9% measured per order line. The percentage matters less than the definition. Confirm whether the denominator is lines, orders or units, and confirm which failures are excluded, because a generous exclusion list can lift a reported figure by a full percentage point without changing what customers experience.
Q2: What is a reasonable dock to stock cycle time?
Between 24 and 48 hours is standard for general merchandise, with 4 to 8 hours achievable for priority or promotional lines that have been pre advised. Containers requiring deconsolidation, quality inspection or repacking sit at the longer end. Agree the clock start point explicitly, because providers differ on whether it begins at gate arrival or at unload.
Q3: Should SLA benchmarks differ for B2B and direct to consumer orders?
Yes. B2B pallet out fulfilment is judged on order completeness, documentation accuracy and delivery booking compliance, and errors typically surface as retailer chargebacks. Direct to consumer fulfilment is judged on single line accuracy and delivery timing, and errors surface as returns and reviews. Applying one set of targets to both channels will flatter one and penalise the other.
Q4: How often should 3PL performance be formally reviewed?
Monthly operational reporting, a quarterly business review with commercial stakeholders present, and an annual contract review. Monthly data alone tends to produce reactive fire fighting. The quarterly cadence is where trends get spotted early enough to act on.
Q5: Are service credits or remediation commitments more useful?
Remediation, in most cases. Service credits compensate you after the fact but rarely change behaviour, and if they are set aggressively they usually get priced back into the rate card. A binding requirement to deliver root cause analysis and a corrective action plan within 30 days fixes the underlying issue, which is what actually protects revenue.
Q6: Do stricter SLA benchmarks always increase 3PL costs?
No. Some improvements genuinely require investment, such as additional shifts, extra pick faces or automation. Others are process discipline that a capable provider should already have in place, such as consistent cycle counting or accurate inbound pre advice. Ask any provider to identify which category each improvement falls into, and to justify the difference.
Q7: How should peak season be handled in an SLA?
Define the peak window by date, agree either a revised target or a temporary tolerance band, and set volume thresholds above which the tolerance applies. Handle it during contract negotiation. Trying to agree peak season allowances in late November, when the operation is already under load, rarely ends well for either party.
A dedicated B dynamic Logistics account contact works through this calendar with clients well ahead of October, so peak tolerance bands are agreed rather than improvised.
Q8: What should be measured differently for big and bulky freight?
Damage rate becomes the headline metric rather than pick accuracy, because oversized goods are far more exposed in transit. Add delivery window adherence for booked two person deliveries, assembly or installation completion where offered, and a separate uplift time for returns, which are slower and costlier to collect.
Q9: Can I audit my provider’s performance reporting?
You should insist on it. Ask for transaction level data access rather than summary reporting, agree an annual audit right in the contract, and confirm which system is the agreed source of truth when your figures and theirs disagree. Providers confident in their operation rarely resist this.
The BDL Advantage platform is B dynamic Logistics’ own answer to this, giving clients transaction level reporting rather than a monthly summary assembled after the fact.
Q10: How long should a 3PL contract run?
Two to three years is common in the Australian market, which allows integration and onboarding costs to be recovered while keeping commercial pressure on. Pair the term with an annual service level review and a clearly defined underperformance exit clause, so length does not become a substitute for accountability.
Back to Blog